
Conformal Prediction, Step by Step — Part 0: Why “90% Sure” Should Mean 90%
November 7, 2026 · 7 min read · Conformal Prediction, Uncertainty Quantification, Machine Learning, Statistics
A weather app says "18 °C tomorrow." A better one says "between 15 and 21 °C." The second forecast is less precise, but it is far more useful: you know whether to bring a jacket. And if the app is any good, then over many days, the real temperature should land inside its range about as often as it claims.
Most machine-learning models only give the first kind of answer, a single number or a single label. This series is about a simple, general way to turn any model into the second kind, with a range whose promise you can actually check. It is called conformal prediction.
This post covers four things that every later part relies on:
- why a single prediction is not enough,
- why a model's own error bars are often too optimistic,
- what conformal prediction promises (and what it doesn't),
- the notation we will use for the rest of the series.
The only background you need is comfort with averages and with the idea of a quantile ("90% of the values are below this number").
1. A prediction without a range is half a prediction#
Suppose a model predicts that a house will sell for $310,000. Should you trust it to the nearest dollar? Of course not. But how far off could it be: $5,000 or $100,000? The prediction alone can't tell you, and the decision you make (bid, wait, walk away) often depends on exactly that.
What we want instead is a prediction interval: a range like $250,000 to $370,000 that comes with a promise, such as "ranges built this way contain the true price 90% of the time." For classification, the equivalent is a prediction set: instead of the single label "cat", we get when the picture is unclear, and just when it is obvious.
The word that matters in that promise is 90% of the time. A range is only useful if its stated level is honest.
2. The model's own error bars are too optimistic#
The obvious way to build a range is to ask the model how wrong it usually is. Take its average error on the data it was trained on, and draw a band of about that size around each prediction.
Here is what happens when we try that with a random forest on a small toy problem. The left panel uses the model's own error on its training data to draw a band meant to hold 90% of points. The right panel uses the errors on a separate set of data the model never saw:
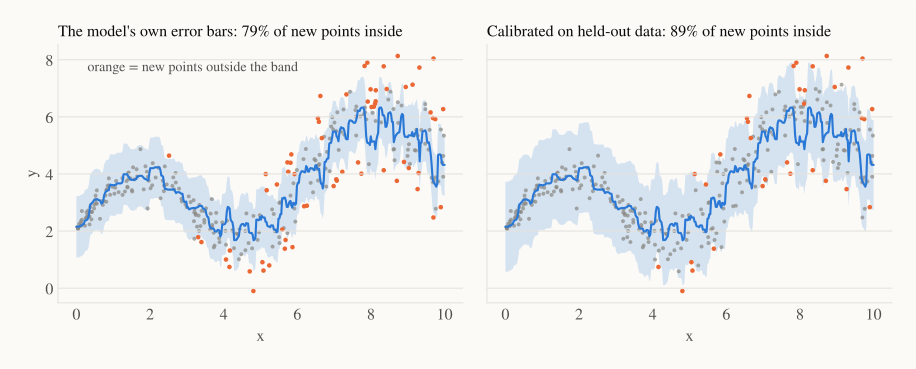
The left band was meant to cover 90% of new points. It covers 79%. The reason is simple: a model has already seen its training data, so its errors there are smaller than its errors on new data. Asking a model to grade its own homework gives a flattering grade.
The right band uses the same model and the same kind of band. The only change is where the errors were measured: on fresh data. It covers 89% of new points, close to the 90% we asked for.
That small change is the whole idea of conformal prediction. In one sentence:
Measure how wrong the model is on data it has never seen, and use the spread of those errors to size the range.
ELI5: imagine a weather forecaster who keeps a notebook. Each day she writes down how far off yesterday's forecast was. To say how sure she is about tomorrow, she doesn't trust her gut. She opens the notebook and says: "90% of my past misses were within 3 degrees, so tomorrow is 18 ± 3." Conformal prediction is that notebook, written down carefully.
3. What conformal prediction promises#
Conformal prediction gives a guarantee called coverage. If we ask for 90%, then
where is the range (or set) we build for a new input, and is the true answer we haven't seen yet. In words: the true answer lands inside our range at least 90% of the time.
Three things make this promise unusual:
- It works with any model. Linear regression, a random forest, a neural network, a large language model: conformal prediction only looks at the model's errors, never at its insides.
- It needs no assumptions about the shape of the errors. No "the noise is Gaussian." The errors can be skewed, heavy-tailed, anything.
- It holds for any amount of data, not just "approximately, when the dataset is large."
It does need one assumption, called exchangeability. In plain words: the new point comes from the same source as the old ones, and their order doesn't matter. If you shuffled the old points and the new one together, you couldn't tell which one was the new one. Data drawn independently from the same distribution (the usual "i.i.d." assumption) is exchangeable.
Two honest warnings, which later parts come back to:
- "90% of the time" means on average over many new points. It does not mean 90% for every kind of point. A range can cover 98% of cheap houses and 77% of expensive ones, and still average 90%. Part 2 shows how to get closer to "90% everywhere."
- If the new data doesn't look like the old data, the promise breaks. A model trained on last year's prices and checked on this year's market is not exchangeable. Part 5 shows what to do about it.
4. The recipe, and the notation#
Every method in this series follows the same three steps. Only the details change from part to part:
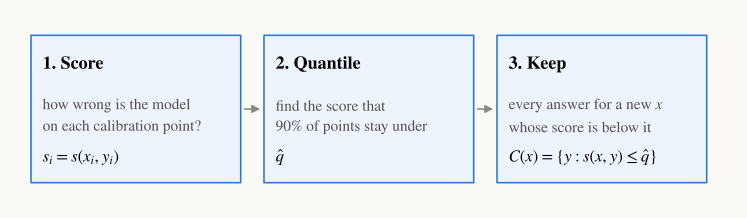
- Score. For each point in a held-out calibration set, compute a number that says how badly the model did on it. For regression, the simplest score is the absolute error .
- Quantile. Find the value that about 90% of the calibration scores stay below.
- Keep. For a new input , keep every possible answer whose score would be at most . For the absolute error, that is just the interval .
Here is the notation used in every part:
| Symbol | Meaning |
|---|---|
| the trained model (any model) | |
| the calibration set: labelled points the model was not trained on | |
| the score: how badly the model does on the pair . Bigger means worse. | |
| the error rate we accept, e.g. | |
| the coverage we ask for, e.g. 90% | |
| the threshold from step 2, a quantile of the calibration scores | |
| the prediction interval or set for a new input |
There are two families of conformal methods, and the series covers both. Split conformal (also called inductive) trains the model once, scores a separate calibration set once, and uses the same for every new point. It is cheap and is what most people use. Full conformal (also called transductive) reasons about each new point separately and refits the model for every candidate answer. It is expensive but wastes no data. We start with split conformal and come back to full conformal in Part 4.
5. In code: the whole idea in a few lines#
Here is the recipe on made-up data. The "model" predicts 0 for everything, and the true values are noise around 0, so the scores are just the sizes of the errors:
import numpy as np

rng = np.random.default_rng(0)
y_cal = rng.normal(0, 1, 2000)            # calibration answers
pred_cal = np.zeros(2000)                 # the model's predictions for them

scores = np.abs(y_cal - pred_cal)         # 1. score
n, alpha = len(scores), 0.1
k = int(np.ceil((n + 1) * (1 - alpha)))   # 2. quantile (Part 1 explains the n + 1)
q_hat = np.sort(scores)[k - 1]

y_new = rng.normal(0, 1, 100_000)         # 3. keep: interval 0 ± q_hat
print(f"q_hat = {q_hat:.2f}, coverage = {np.mean(np.abs(y_new) <= q_hat):.3f}")
# q_hat = 1.63, coverage = 0.897
The 90% Gaussian quantile is 1.645, so is close, and we found it without ever being told the noise was Gaussian.
Recap#
- A prediction is much more useful with a range, but only if the range's stated level is honest.
- A model's own error on its training data is too small, so error bars built from it cover less than they claim.
- Conformal prediction measures errors on held-out data and uses their quantile to size the range. It works with any model and any error shape, for any sample size.
- The guarantee is coverage on average, and it needs exchangeability: new data must look like the old data.
- Every method follows the same recipe: score, quantile, keep.
Next up — Part 1: Split Conformal, the Whole Trick. We build the method properly on a real dataset (California house prices), explain where the strange comes from with a short proof, and then check the guarantee ourselves by running it a thousand times.